This particular article brings a complete and novel approach to answer that question, a single unitary metric that judges how to calculate best test performance In Cricket.
This is not a matter of opinion, a reminiscence, or a reputation, but a measurement system that quantifies the best performances in Test matches. At the heart of this is the Match Performance Index (MPI), which is a combination of two highly sophisticated analytical engines:
How To Calculate Best Test Performance In Cricket?
Context Driven Performance Ratings (BAT-100 & BOW-100)
Together, they list the Greatest Test Performance that has been recorded.
1. Team Performance Points (TPP) – Match Contribution Assessment


The Team Performance Points (TPP), a capped system, allocates a total of 100 points per Test match, from match to teams, matches, disciplines, and then players.
This has been developed a long time back with a rigorous top-down process involving five stages, ensuring that:
- Every performance is judged by reference to the match
- Contributions throughout the entire four-innings match are recognized
- No inflation from runaway victories or weak opposition
- Core Principles of the Contribution Model
- Scorecard-only Analysis
No team reputation, playing form, or historical bias is considered. This means that if the scorecard is different, although with different teams, the contribution values would be the same.

Top-down validation followed by bottom-up
The contributions are from the match, via teams, through innings, to players, and are therefore rewritten at the match level.
Equalisation of batting and bowling
Wherever possible, contributions from batting as well as from bowling are adjusted.
Ceiling-based valuation
For instance, with a point cap of 100 per game, it is easy to identify superiority because it is
– 50.0:50.0 for a tie (the anchor value – the Brisbane and Madras tied games).
Read More

– 50.1:49.9 for a one-run win (Adelaide, 1993 – West Indies 252 and 146, Australia 213 and 184).
– 50.4:49.6 for a one-wicket win (Durban, 2019 – South Africa 235 and 259, Sri Lanka 191 and 304 for 9).
– 71.2:28.8 for a nine-wicket win (Christchurch, 2017 – Bangladesh 289 and 173, New Zealand 354 and 111 for 1).
– 90.6:9.4 for a win by an innings and 198 runs (Sharjah, 2002 – Pakistan 59 and 53, Australia 310).
– 94.2:5.8 for a 675-run win (Brisbane, 1928 – England 521 and 342 for 8, Aus 122 and 66).
– 50.6:49.2 for India for the draw with scores level and nine wickets down (Mumbai, 2011 – West Indies 590 and 134, India 482 and 242 for 9).
– 49.0:46.5 for Australia for the recent fighting draw by India down under (Sydney, 2021 – Australia 338 and 312 for 6, India 244 and 334 for 5).
– 74.5:23.1 for South Africa for the near-win draw at Wanderers (Johannesburg, 1967 – Australia 143 and 148 for 8, South Africa 332).
– 43.4:30.9 for a three-innings draw (Wellington, 2018 – Sri Lanka 282 and 287 for 3, New Zealand 578).
– 0.3:0.1 for a 10-ball draw (North Sound, 2009 – Eng 7 for 0).
2. Greatest Individual Efforts in a Test Match
To avoid the effect of a large victory, performances are judged on a percentage basis with regard to the overall team scoring.
GOCC = Overall Match Contribution
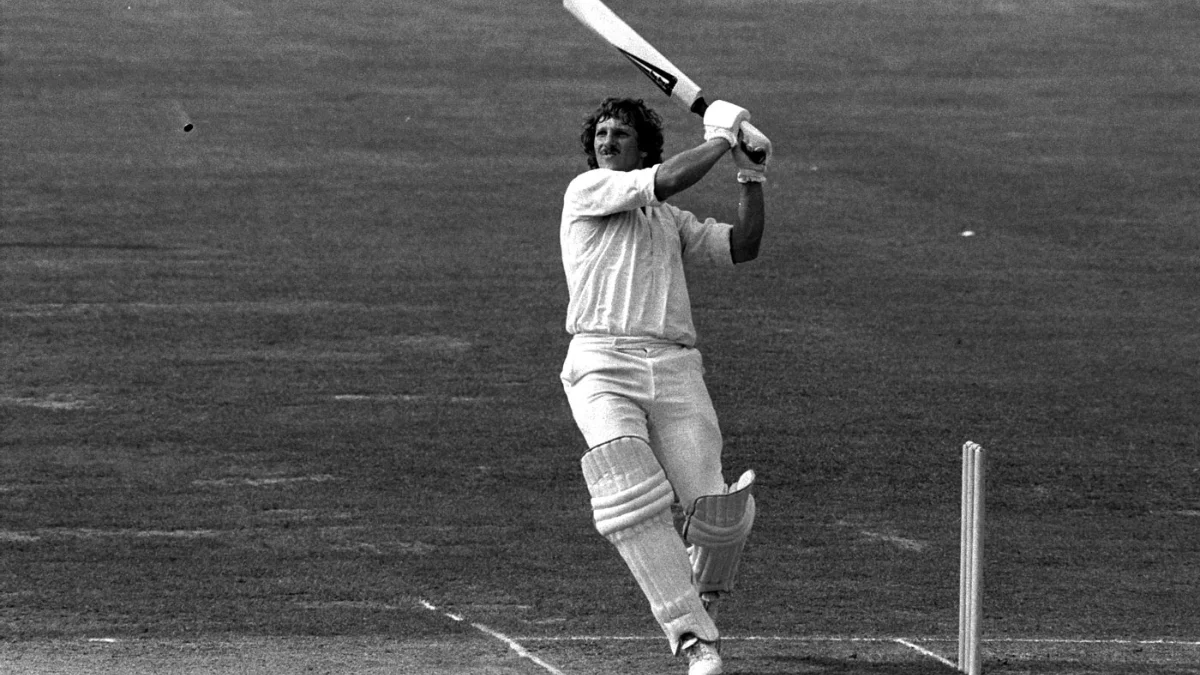
Ian Botham – Wankhede, Mumbai 1980
114 runs (from 58/6 & 7/48)
TPP = 74.3
47% of overall English match performance
This remains the single greatest Test performance by contribution.
Other elite performances are:
Johnny Briggs (1889): 15 wickets
Jim Laker (1956): 19 Wickets
Muttiah Muralidaran (1998): 16 wickets
Wiaan Mulder (2024): 367*
3. BAT-100: Contextual Batting Performance
BAT-100 has multiple applications, including: BAT-100 analyzes a
- Match situation at entry
- Percentage of team runs
- Standard of bowling attack
- Pitch Difficulty
- Strike rate relative to conditions
- Match result and pressure moments
The theoretical high of 1000 points establishes the Greatest Test Batting Performance.
Top Test Bowling Efforts (BWL-100)
Kusal Perera – 153 vs South Africa, Durban 2019* 965
Kyle Mayers – 210 vs Bangladesh, 2021
VVS Laxman – 281 vs Australia, 2001
Brian Lara – 153 vs. Australia, 1999
Ben Stokes – Headingley 2019
4. BOW-100: Contextual Bowling Performance
Bowling performances are assessed on the following:
- Wicket quality
- Match phase
- Pitch behavior
- Batter resistance
- Other support from bowlers
Once more, the theoretical high is 1000 points.
5. Match Performance Index (MPI), The Ultimate Measure
Neither Contribution nor Context alone can define the Greatest Test Performance. MPI combines contributions and context.
MPI Formula
Match Performance Index (MPI) = (Batting Contribution Points + Bowling/Fielding Contribution Points) + (1.05*Batting Rating Points + 0.95*Bowling Rating Points) / 75.
Why This Works?
- Values for contributions bring meaning to scorecard parlance
- Ratings assess pressure, resistance, and importance
Batting is considered slightly more important because there are fewer opportunities. The scale enables balance and similarity over the ages.
6. Greatest Test Performances of All Time (MPI Rankings)
Ian Botham – Wankhede,
The ultimate Greatest Test Performance of all.
Richard Hadlee – Christchurch, 1984
Johnny Briggs – Cape Town, 1889
Mushtaq Mohammad – Port of Spain, 1977
Billy Bates – Melbourne, 1883
ALSO READ: Shubman Gill vs Sanju Samson: T20I Statistics In 2025