In the Anderson-Tendulkar Trophy, India had drawn the series with a dramatic win by 6 runs at the Oval, London. The competitive narrative of the drawn series, as reflected in the series score, shows their competitive performance.
India’s post-series data provide very convincing evidence that India outperformed England in all the major metrics covering their actual performance, where we used batting, bowling, and control percentage data. Despite being close to a 3-1 series loss, India excelled in many of the significant performance areas, despite England’s win, particularly in control percentage data and overall consistency.
Control Percentage: India’s Batting Domination

Control percentage indicates the effectiveness of batters and their control of the deliveries they received, recording how many of those balls were received without a mistake.
Control percentage is an important statistic in evaluating how effectively batters handle various types of deliveries through the absence of mistakes while leaving the ball or playing and missing. India was exceptional in this regard, as their batsmen controlled 84.6§ of the balls they faced as opposed to 78.2% for England batters.

But this increased percentage of control does not tell the whole story since false shots are of different risks. A batter depositing a ball that is for the stumps, for instance, is a much greater mistake than one missing a delivery down the leg side. Nonetheless, India’s batters were much more in control, with Shubman Gill taking the lead with a magnificent 90% control rate, followed closely by KL Rahul at 88.5%.
Shubman Gill and KL Rahul: The Control Masters
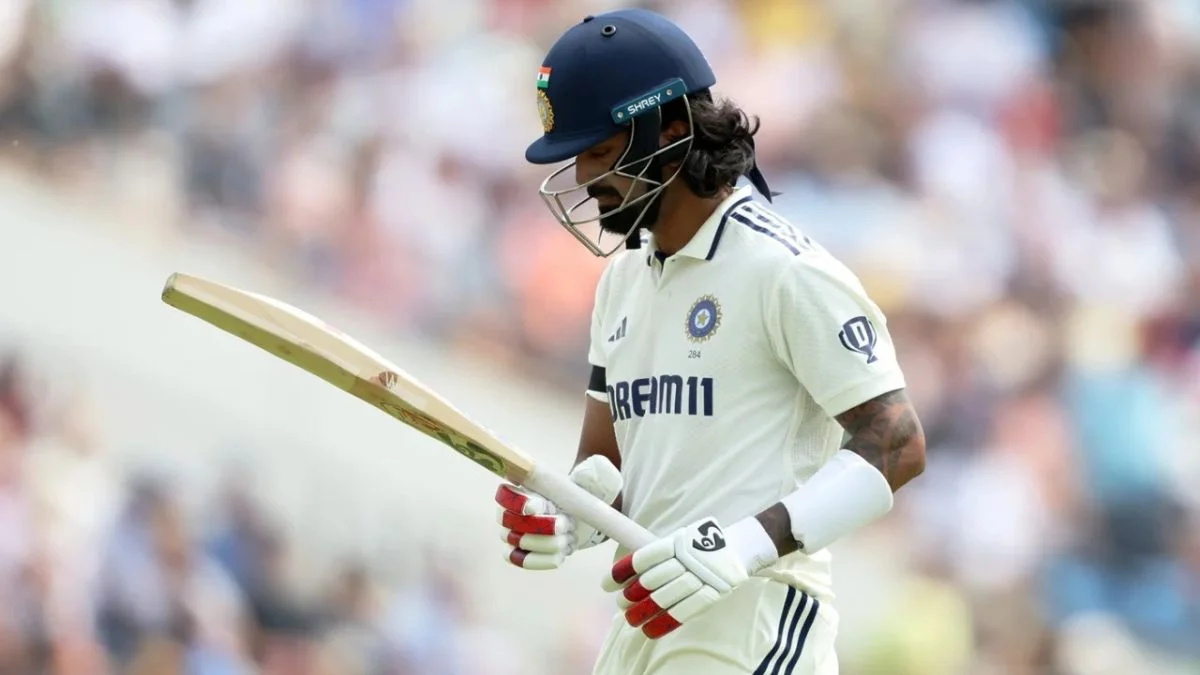
India’s openers, Shubman Gill and KL Rahul, also demonstrated outstanding control, especially when compared to their English counterparts. Gill, who had a series average of well over 40, topped the run charts as well as having a healthy lead in control percentage.
His consistency in guiding the team through pressure spots meant that he dominated the series, having a control rate much higher than any other batter on either team.

KL Rahul, even with an orthodox style, also played with huge consistency and hit 88.5% of his shots, which was a remarkable achievement. His orthodox style was in complete contrast to England’s aggressive style. His style made him a wee bit less error-prone, something that came in handy in this tough series.
England’s Aggressive Play vs India’s Consistency
One of the most compelling stories in the Anderson-Tendulkar Trophy Stats is the contrast between England’s aggressive style and India’s strong, orthodox approach.
England’s Bazball tactic is one of scoring quickly, and if spectacular things don’t sometimes follow, it is because it involves risking more mistakes. England’s batsmen tend to play false shots, especially in pursuit of runs. Just 29.6% of their mistakes were made while defending, compared to 38.8% for India.
But then, this attacking approach generally proves to be in England’s favour in terms of runs per dismissal. Though they make more errors, England tends to score faster when they dominate, resulting in more runs per shot.
But in this series, India’s batsmen were more consistent and scored 3.6 runs per shot, while England mustered only 3.0. This difference is the result of England attempting to play aggressively but failing to turn their control into more scoring.
Bowling Statistics: India’s Pacers Dominate the Stage
India’s bowlers not only extracted more false shots but also applied greater pressure throughout the series. While India’s bowlers provoked a false shot 21.8% of the time, England’s bowlers achieved only 15.4%.

Among India’s pacers, Prasidh Krishna and Mohammed Siraj were outstanding, achieving false-shot percentages of 28.7% and 26.8% respectively. This reflected on their line and length being quite effective in curbing England’s aggressive batsmen.
By contrast, the pace of bowlers like Gus Atkinson and Josh Tongue was surprising for everyone when checking their strike rate and their ability to force mistakes. Tongue had a fake-shot rate of 20.3%, while Atkinson, in the single Test he played, forced 22% fake shots, giving some idea of the capabilities of England when their bowlers can be precise.
Batting against Top Opposition Bowlers: A Tactical Battle
The Anderson-Tendulkar Trophy Stats provide a better perspective on the dynamics of the head-to-head battle between batters and bowlers, even on an individual basis. Jasprit Bumrah and Akash Deep both offered similar impressive statistics while playing for India, especially on England’s top five batsmen.
Bumrah had an average of less than 35 runs given to the top England batsmen, meaning he was able to deliver predictable false shots consistently. Mohammed Siraj created an impressive 171 false shots, but frustratingly, only averaged 64.37 runs given per wicket.
On the whole, England’s Jofra Archer was the most effective against India’s top order, accounting for the start of Jaiswal and Pant, although his control % was also less than 30. Archer had matching disciplined pathways as Tongue, who averaged just 39 runs per wicket.
Strike Rates: England Struggles to Maintain Aggression
Treating the absence of England’s famous Bazball approach could only stem from a poor strike rate in delivery when in control at the stadium. When we juxtaposed at a strike rate of 71.8 in delivery whilst in control against a low strike rate in delivery on their Bazball tests, if summarised, the batsmen do no wrong and for any mistakes still accumulate runs whilst in control.
England’s overall batting strike rate of 64.43 could be less envious, dividing their collective workers in terms of low strike rates recorded in the Bazball series in comparison to their established standard during the 2023 Ashes of 74.14.
The batsman from India operated with more restraint, the only exception being KL Rahul and his score of 49.9. Collectively, the batting was orthodox and suppressed. The ordinariness of their run rate provided a substantial enough platform to keep their run rate reasonable throughout the series.
FAQs on Anderson-Tendulkar Trophy Stats
1. Which Indian batter possessed the maximum control percentage in the series?
Shubman Gill was at the forefront with a 90% control percentage, indicating his consistency and accuracy in the crease.
2. What effect did England’s aggressive nature have on their performance in the series?
England’s aggressive Bazball style meant there were more false shots, decreasing the control percentage and runs per false shot, affecting their performance throughout this series.
3. What was India’s bowling edge over England?
India’s bowlers, particularly Prasidh Krishna and Mohammed Siraj, produced more percentage of false shots, putting England’s batters into more errors and capitalizing on their chances.
ALSO READ: Haider Ali Suspended By PCB: Under Investigation For Greater Manchester Police Investigation